No one will argue that 2020 was an interesting year, and the weather was no different. Here we will breakdown high temperatures, low temperatures, and precip stats for the year and how they compare to average. All data are from 1896 through 2020 (Phoenix long term record) and are referencing the year-long statistic.
Let's start with temperature stats!
Highest high temperature this year: 118º
(ties as the 4th warmest temperature on record)
Record Highest: 122º in 1990
Record lowest high: 109º in 1911
Lowest high temperature this year: 55º
(ties as 3rd warmest lowest high on record)
Record highest lowest high temperature: 58º in 1989
Record lowest high temperature: 36º in 1898
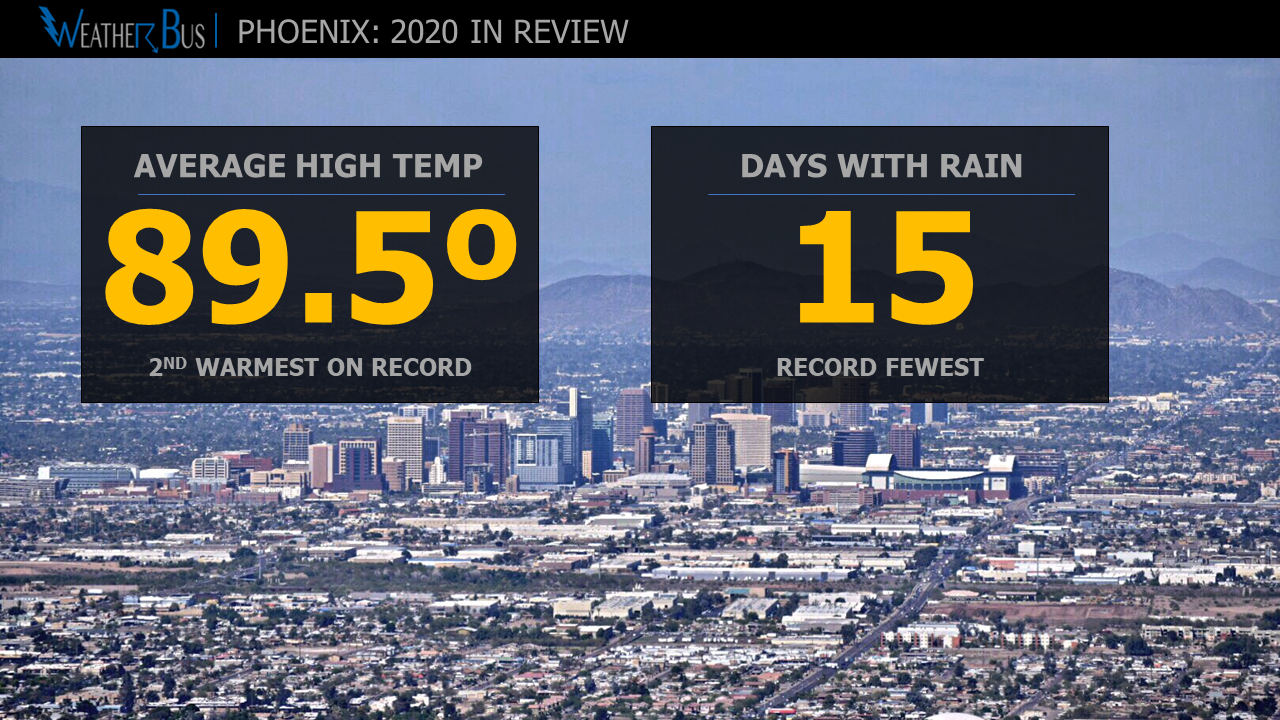
Average high temperature this year: 89.5º
(second warmest on record)
Record highest average high temperature: 89.8º in 1989
Record lowest average high temperature: 81.4º in 1913
Lowest low temperature this year: 35º
(ties as the 3rd warmest low temperature on record)
Record lowest low temperature: 16º in 1913
Record highest losest low temperature: 37º in 1986
Warmest low temperature this year: 94º
(ties as 3rd warmest high low temperature)
Warmest low temperature: 96º in 2003
Lowest high low temperature: 81º in 1915
Average low temperature this year: 64.9
(ties as 3rd warmest)
Highest average low temperature: 65.4 in 2014, 2015, 2017
Lowest average low temperature: 53.2 in 1917
And finally, some precipitation stats:
Total rainfall this year: 5.00"
(27th driest year on record)
Lowest rainfall: 2.82" in 1956 and 2002
Highest rainfall: 19.73" in 1905
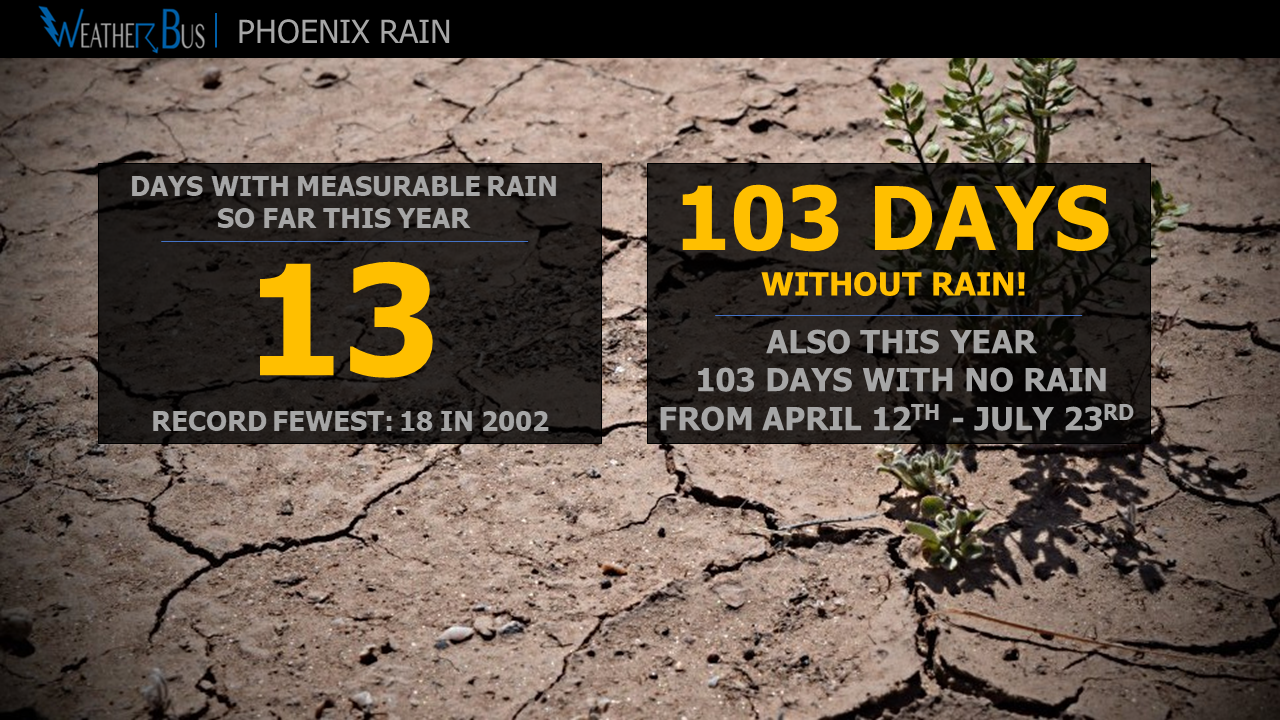
Number of days with rain this year: 15
(record fewest - the old record was 18 in 2002)
Most days with rain: 74 in 1905
Most rain in one day this year: 1.04"
(ties as the 35th most)
Most rain in one day: 3.30" in 2014
Least most rain in one day: 0.42" in 1947
We will break down some of these stats in more detail in the next week or so.
