Monsoon 2021 has been active, and now the main question to ask is: will August be active in Phoenix since July was?
There is no way around it; this is a very complex question as weather forecasting, even sometimes out just a few hours, is tricky during monsoon, but here we will dive into the numbers and see what they say regarding the odds of an active August. Warning: this might get a little number heavy, so read at your own risk! This analysis is also just a quick free time on the weekend so just "nerding out" type look.
Let's first look at a simple rainfall comparison of if you have a wet July what happens in August (don't worry, we will dig deeper).
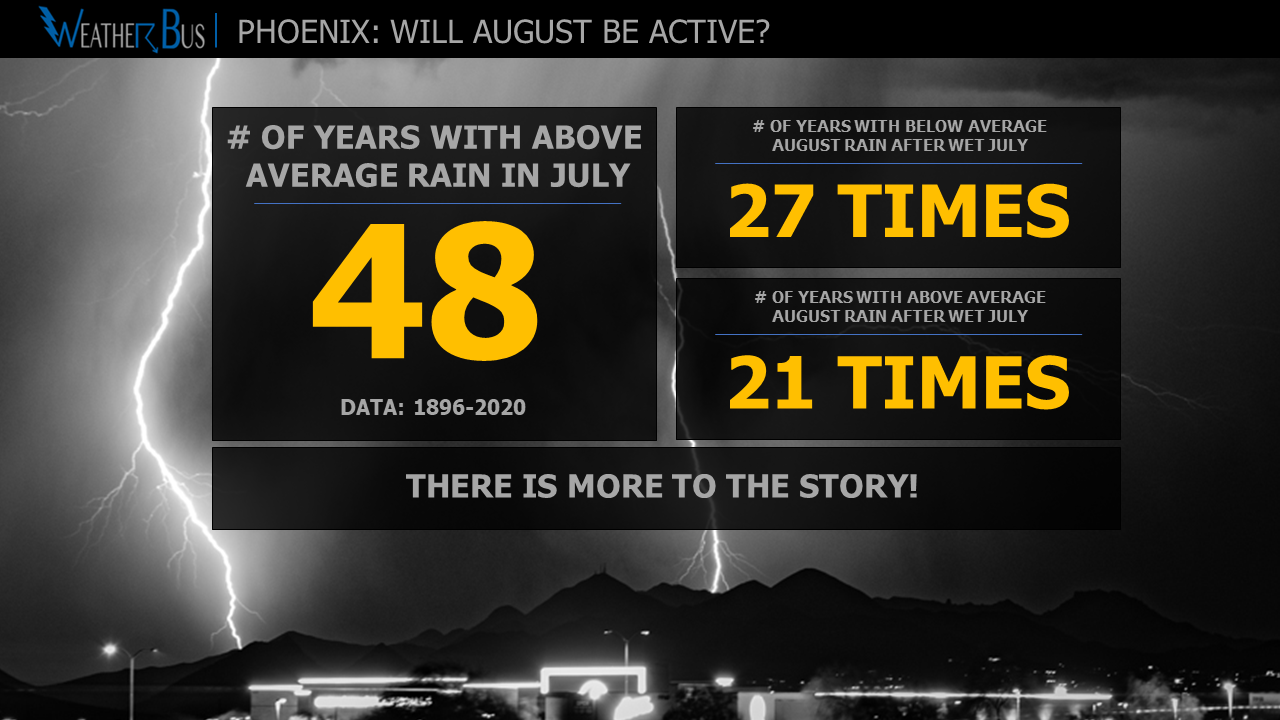
Using rainfall data from Phoenix: (data range 1896 to 2020)
Since 1896, July has measured above-average rainfall 48 times. Out of those 48 times, a total of 27 times (56%), August measured below-average precipitation, and 21 times (44%) rainfall was above average following a wet July.
Using the Phoenix Rainfall Index: (data 1990 - 2020)
Since 1990, July has measured above-average precip 15 times. Out of those 15 times, a total of eight times (53%) August has measured below-average precipitation and seven times (47%) rainfall has been above average following a wet July.
This simple comparison shows there is a very slight "lean" toward coming in below average in August if July is wet, but not much better odds than just flipping a coin, so let's see if we can get a bit better.
Bring in ENSO!
For the second comparison, let's bring El Niño-Southern Oscillation (ENSO) into the picture to see if it help us to get past just flipping a coin.
For this comparison, we will cut Phoenix Sky Habor data down to 1950 to 2020 as ENSO data only goes back to 1950. We will also not use the Phoenix Rainfall Index since data only go back to 1990, so it severely limits the ability to have a good comparison.
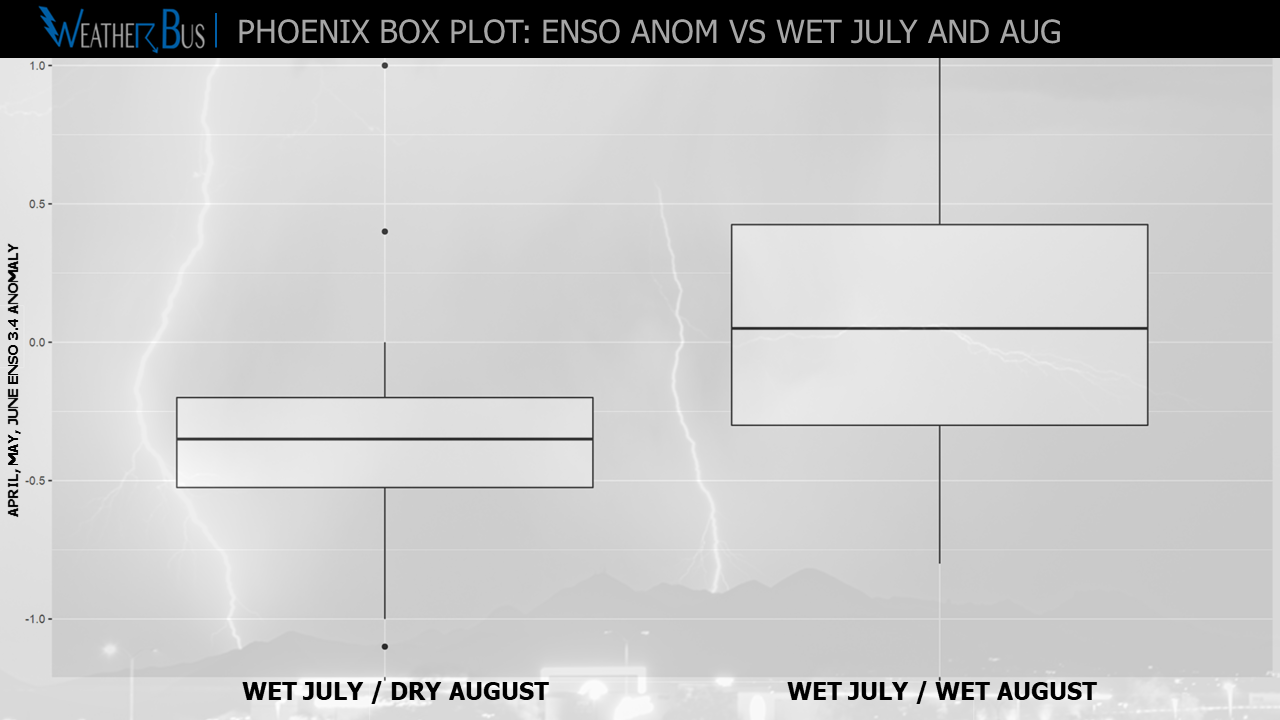
The first task was to break rainfall data into two categories: (1) above average July rainfall, followed by an above-average August, and (2) above average July rainfall, followed by a below-average August. We then compared those groups with the three-month average ENSO 3.4 anomaly, using a Kruskal-Wallis test, and some interesting points emerged.
 Looking at ENSO from March through September in three-month blocks showed that only the ENSO 3.4 three-month average of April, May, and June (AMJ) was statistically significant at the 95% confidence interval. So we will focus our attention there.
On average, the ENSO 3.4 AMJ anomaly for the years in which there was a wet July but a below-average August came out to -0.33. When both July and August saw above-average rainfall, the average ENSO 3.4 anomaly was 0.08.
This year, the ENSO 3.4 AMJ anomaly was -0.50, which, based on the above-mentioned statistics, would tilt our odds fairly heavily toward a below-average August.
Furthermore, looking at the 16 years where there was a wet July and a dry August, seven of them (43%) had an ENSO 3.4 AMJ anomaly of -0.5 or less, with 13 of the 16 years (81%) having a negative anomaly. Three out of the 16 years (19%) had an ENSO 3.4 AMJ anomaly of zero or greater.
Meanwhile, looking at the 12 years there was a wet July and August, only two (16%) had an ENSO 3.4 anomaly of -0.5 or less, with six out of 12 (50%) having a negative ENSO 3.4 anomaly. The other six (50%) had an ENSO 3.4 anomaly of zero or greater.
To bring the Phoenix Rainfall Index back into the picture, as it really does tell a great story of rainfall in the Valley, there have only been 15 times since 1990 that there has been an above-average July, so again, data points are spares... Looking at all the years August measured below average rain, with an above-average July, the average ENSO 3.4 AMJ anomaly came in at -0.28. The ENSO 3.4 anomaly when above-average August rainfall occurred after a wet July came in at -0.03. Even with sparse data points, it is nice to see that this shows a similar pattern as the Phoenix Sky Harbor data.
The final thoughts!
So, what does all this mean? The simple comparison of just rainfall leans slightly toward a drier August after a wet July. Since this year the April, May, and June ENSO 3.4 anomaly was -0.50, this also statically shows that odds are higher that Phoenix will have a below-average August. Based on this, I would go with the assumption that it could certainly be less active this August compared to July.
This also makes sense, as all forecasts are trending toward La Nina, which could limit the potential for a more active East Pacific Hurricane Season, which limits the odds of copious moisture surging into Arizona from these storms.
With all of this said, it is still VERY important to be ready for rapidly changing weather throughout monsoon. This analysis is simply looking at the numbers and by no means is a day-by-day forecast. Severe thunderstorms with very heavy rainfall are certainly still possible! It only takes one or two good storms to hit the right location to make the record books show a very wet monsoon (or in this case August).
Bottom line, there are some hints that point toward a below-average August but remember it is all about location, location, location!
If you made it to the bottom of this: congratulations!
