Weather Facts

Looking for fun weather facts? This category contains all topics dealing with weather facts.

Apache Junction Flooding: How many gallons of rain fell?

- Posted in Weather Facts by

We all see the photos/videos of running washes and heavy rain but just how much water is falling from the sky?

Using Maricopa County Flood Control rain gauges and some personal weather stations to fill in the gaps, on average, approximately 1.90" fell over the nearly 16,000-acre area noted in the yellow box (image above) on July 28, 2022.

Using the fact that there are ~27,154 gallons of water when one inch of rain falls on an acre of ground, that brings us to a total of ~820,219,154 gallons of water that fell in a very short period of time across the area.

To put this into a little more context, that is enough water to fill the swimming pool in Chase Field 96,496 times. In other words, a lot of water.

As you can see, even though an inch of rain does not seem like a lot, it adds up quickly resulting in running washes and flooding.

First 100º+ Day In Phoenix

- Posted in Weather Facts by

The first 100º+ day of the year in Phoenix is guaranteed to happen every year, and this year was no exception! At 2:12pm on May 7th, the temperature reached the 100º mark. If you don't like the heat, at least this year was well past the average of May 2nd, and the latest first 100º+ day since 2010!

Looking at the long-term record (since 1896), the latest first 100º day was back in 1913, when we held off until June 18th! The earliest on record was in 1988, when we had the pleasure of hitting the century mark on March 26th.

What weather changes take place in Phoenix during spring?

- Posted in Weather Facts by

Winter ended and spring officially started this year on March 20th at 8:33 am! So what are the changes that take place from the start of spring to the start of summer on June 21 at 2:13 am?

Over the next three months, the average high temperature in Phoenix will go from 79º to 106º, a 27º increase!

The average low temperature will start spring at 54º and warm to 79º by the end. Yes, the average high temperature at the start of spring becomes the average low temperature by the end of spring.

As for rain, spring is certainly not the wettest season, with on average only 0.60 inches of rain falling. The majority of that falls in late March and early April.

Bottom line, fasten your seatbelt and get ready for a big warming trend as summer is fast approaching!

Could Phoenix break the "Big 4" rain record?

- Posted in Weather Facts by

Nothing beats fun weather facts, and here's an interesting one! Since Phoenix weather records began in 1896, measurable rain has never fallen on Christmas Eve, Christmas Day, New Year's Eve, and New Year's Day in the same season!

In fact, measurable rain has only been recorded on at least three of the "Big 4" three times.

This year (2021) it is possible we could break the record and have the first year with measurable rain on all four days! Phoenix already recorded a record-setting 1" of rain on Christmas Eve and Christmas Day managed to get another 0.01". There is a good chance of rain on New Year's Eve but the trick will be New Year's Day as rain chances will quickly come to an end around midnight. Can we keep the rain going just a few hours longer? Time will tell!

At the very least, this year will likely join the ranks and become the 4th time rain has fallen on at least three of the big holidays.

Phoenix's 58-day dry streak ends!

- Posted in Weather Facts by

It rained! Around 7:35 pm on December 9th, the rain gauge at Phoenix Sky Harbor measured the first 0.01" since October 11th!

While this dry streak certainly felt like a long one, it is nowhere near the record, which stands at 160 days (no rain from December 30, 1971 through June 6, 1972).

As for rainfall totals with this past storm, Phoenix Sky Harbor officially picked up 0.35", bringing the yearly total to 5.93". The year-to-date average is 6.71", so we still have some work to do before the end of the year.

First low below 50º in Phoenix this season!

- Posted in Weather Facts by

The low temperature at Phoenix Sky Harbor bottomed out at 49º during the morning of Sunday, November 28th. This low temperature marks the first time this fall with a low below 50 degrees.

If you thought it was a little late, you would be right; this year ties as the fourth latest on record. The latest on record is December 7th, which occurred in 2017. On the flip side, the earliest on record is September 20th, which occurred in 1965.

So is the first below 50 degree low temperature of the spring season getting later? Looking at data from 1896 to current (graph above), the answer is yes. The 30-year rolling average in 1925 had the first below 50-degree day occurring around October 17th. Using the last 30 years (including this year), the average is around November 13th.

Does a wet July mean a wet August in Phoenix?

- Posted in Weather Facts by

Monsoon 2021 has been active, and now the main question to ask is: will August be active in Phoenix since July was?

There is no way around it; this is a very complex question as weather forecasting, even sometimes out just a few hours, is tricky during monsoon, but here we will dive into the numbers and see what they say regarding the odds of an active August. Warning: this might get a little number heavy, so read at your own risk! This analysis is also just a quick free time on the weekend so just "nerding out" type look.

Let's first look at a simple rainfall comparison of if you have a wet July what happens in August (don't worry, we will dig deeper).

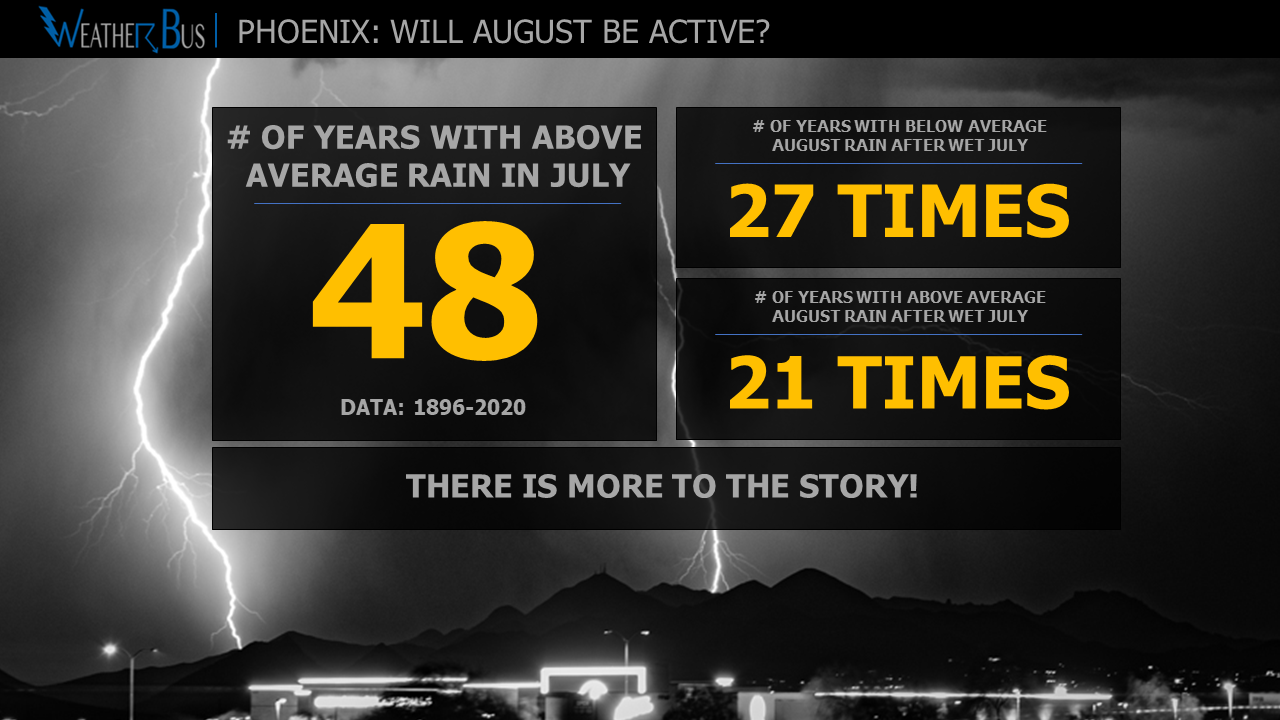
Using rainfall data from Phoenix: (data range 1896 to 2020)
Since 1896, July has measured above-average rainfall 48 times. Out of those 48 times, a total of 27 times (56%), August measured below-average precipitation, and 21 times (44%) rainfall was above average following a wet July.

Using the Phoenix Rainfall Index: (data 1990 - 2020)
Since 1990, July has measured above-average precip 15 times. Out of those 15 times, a total of eight times (53%) August has measured below-average precipitation and seven times (47%) rainfall has been above average following a wet July.

This simple comparison shows there is a very slight "lean" toward coming in below average in August if July is wet, but not much better odds than just flipping a coin, so let's see if we can get a bit better.

Bring in ENSO!

For the second comparison, let's bring El Niño-Southern Oscillation (ENSO) into the picture to see if it help us to get past just flipping a coin.

For this comparison, we will cut Phoenix Sky Habor data down to 1950 to 2020 as ENSO data only goes back to 1950. We will also not use the Phoenix Rainfall Index since data only go back to 1990, so it severely limits the ability to have a good comparison.

The first task was to break rainfall data into two categories: (1) above average July rainfall, followed by an above-average August, and (2) above average July rainfall, followed by a below-average August. We then compared those groups with the three-month average ENSO 3.4 anomaly, using a Kruskal-Wallis test, and some interesting points emerged.

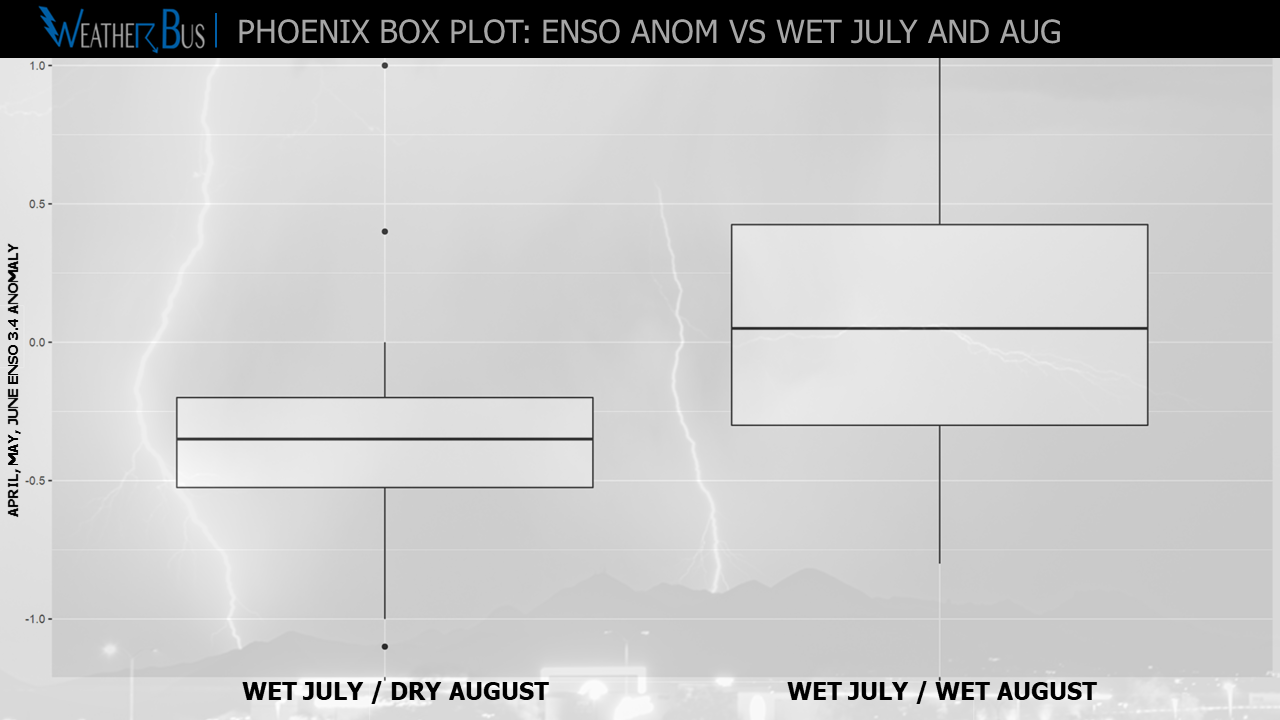
Looking at ENSO from March through September in three-month blocks showed that only the ENSO 3.4 three-month average of April, May, and June (AMJ) was statistically significant at the 95% confidence interval. So we will focus our attention there.

On average, the ENSO 3.4 AMJ anomaly for the years in which there was a wet July but a below-average August came out to -0.33. When both July and August saw above-average rainfall, the average ENSO 3.4 anomaly was 0.08.

This year, the ENSO 3.4 AMJ anomaly was -0.50, which, based on the above-mentioned statistics, would tilt our odds fairly heavily toward a below-average August.

Furthermore, looking at the 16 years where there was a wet July and a dry August, seven of them (43%) had an ENSO 3.4 AMJ anomaly of -0.5 or less, with 13 of the 16 years (81%) having a negative anomaly. Three out of the 16 years (19%) had an ENSO 3.4 AMJ anomaly of zero or greater.

Meanwhile, looking at the 12 years there was a wet July and August, only two (16%) had an ENSO 3.4 anomaly of -0.5 or less, with six out of 12 (50%) having a negative ENSO 3.4 anomaly. The other six (50%) had an ENSO 3.4 anomaly of zero or greater.

To bring the Phoenix Rainfall Index back into the picture, as it really does tell a great story of rainfall in the Valley, there have only been 15 times since 1990 that there has been an above-average July, so again, data points are spares... Looking at all the years August measured below average rain, with an above-average July, the average ENSO 3.4 AMJ anomaly came in at -0.28. The ENSO 3.4 anomaly when above-average August rainfall occurred after a wet July came in at -0.03. Even with sparse data points, it is nice to see that this shows a similar pattern as the Phoenix Sky Harbor data.

The final thoughts!

So, what does all this mean? The simple comparison of just rainfall leans slightly toward a drier August after a wet July. Since this year the April, May, and June ENSO 3.4 anomaly was -0.50, this also statically shows that odds are higher that Phoenix will have a below-average August. Based on this, I would go with the assumption that it could certainly be less active this August compared to July.

This also makes sense, as all forecasts are trending toward La Nina, which could limit the potential for a more active East Pacific Hurricane Season, which limits the odds of copious moisture surging into Arizona from these storms.

With all of this said, it is still VERY important to be ready for rapidly changing weather throughout monsoon. This analysis is simply looking at the numbers and by no means is a day-by-day forecast. Severe thunderstorms with very heavy rainfall are certainly still possible! It only takes one or two good storms to hit the right location to make the record books show a very wet monsoon (or in this case August).

Bottom line, there are some hints that point toward a below-average August but remember it is all about location, location, location!

If you made it to the bottom of this: congratulations!

Coolest July day in Phoenix since 1964!

- Posted in Weather Facts by

Many of us were focused on the record-setting rain that moved through the Phoenix valley, but the temperatures were rather impressive as well!

The high temperature at Phoenix Sky Harbor on Friday , July 23rd was only 83º, which is the coolest July day since 1964! To put this into context, the average low temperature for this time of year is 85º, so the high temperature was even below the average low temperature! This is also only the 11th time since records began in 1896 that the high temperature has been at or below 83º during the month of July.

In case you were wondering, the coolest July day on record stands at 79º, which occurred on July 1, 1911.

Here is a list of all the other days in July with a high of 83º or less:
July 1, 1911: 79º
July 2, 1911: 82º
July 24, 1912: 82º
July 25, 1915: 81º
July 31, 1921: 82º
July 31, 1950: 80º
July 23, 1954: 82º
July 24, 1955: 80º
July 25, 1955: 83º
July 31, 1964: 83º
July 23, 2021: 83º

Phoenix: First 100º+ day of 2021

- Posted in Weather Facts by

The first 100º day of the year signals the unofficial start to summer, and this year, it happened right around 2:15 pm on May 5th.

Using the new 1991-2020 thirty-year averages, the average first 100º+ day occurs on May 2nd. The earliest 100º+ day occurred on March 26th back in 1988, and the latest was in 1913 when it held off until June 18th!

And if you thought this was a little late compared to recent years, you would be right. This is the latest first 100º day since May 21, 2010.

The Valley of the Sun averages 111 days a year with a high of 100º+, so looking at the positive side, only about 110 more days to go!

Yuma hits 100º for the first time the year

- Posted in Weather Facts by

On Friday (April 30th), Yuma recorded a high of 101º, making it the first time to reach or exceed the century mark this year. For reference, the 1981-2010 average first day is April 22nd, so over a week past the average.

The earliest first 100º+ day occurred on March 12th in 1916. On the flip side, the latest ever first 100º+ day was June 13th, set in 1971.

On average, Yuma recorded 110 days each year with a high of 100º+.

Page 1 of 4