December 2019 Drought Update

- Posted in Drought by

There is some excellent news when it comes to drought across Arizona: it's improving!

The latest drought monitor update shows 50.54 percent of the state is not in any drought classification. Another 22.84 percent of the state is "Abnormally Dry," which indicates an area that is experiencing dry conditions but is not yet in drought.

With that said, moderate to severe drought still exists in the north/northeast portion of the state, and the National Drought Mitigation Center explains, " In the Four Corners states, the map depiction strives to balance the effect of the recent precipitation with the failure of the monsoon."

This "balance" can be seen looking at the departure from average rainfall graph for Phoenix Sky Harbor (below). From June 15th through September 30th (the monsoon), Phoenix only recorded 0.66 inches of rain, making it the 5th driest on record. At the start of the season (June 15th), the Valley was only 0.19 inches below average for the year, and by the end (September 30th), the gauge was 2.24 inches below average.

The dry weather continued through October before a major storm system moved through the state November 19th - 21st, with a storm total in Phoenix of 0.84 inches. Another strong storm moved through the region on November 28th and 29th, with another 0.71 inches falling at the airport.

While this Fall rain has helped and drought conditions are improving, Phoenix is still sitting 2.26 inches below average for the year when it comes to rain.

Fingers crossed for a wet end to 2019 (there's a chance)!

How Rare Are Tornado Warnings in Phoenix?

- Posted in Weather Facts by

It was a busy morning on November 29th, as a strong cold front swept through the region. These storms even resulted in two tornado warnings for portions of the Phoenix Valley (see radar loop below).

The first tornado warning was issued for a storm near Scottsdale Airport at 4:01 am and expired at 4:15 am. The second tornado warning of the morning was issued at 4:44 am for a storm over San Tan Village Mall. This storm, with radar-indicated rotation, continued moving northeast over Phoenix-Mesa Gateway Airport. The tornado warning was canceled at 4:56 am.

So, the big question: Just how rare are tornado warnings in Phoenix?

To answer this question, we pulled archived weather alerts for Maricopa and Pinal Counties from 1986 to current, from the online database provided through Iowa State University.

From 1986 to present (33 years), only 23 tornado warnings have been issued for Maricopa County and 13 for Pinal County.

So the answer is: Fairly rare!

Below is a list of dates that tornado warnings have been issued for Maricopa and Pinal counties.

List for Maricopa County:
Aug 29, 1987
Nov 1, 1987
Sep 3, 1990
Feb 13, 1992
Jan 17, 1993 - two warnings issued
Jan 18, 1993
Mar 13, 1996
Aug 14, 1997
Sept 7, 2002 - two warnings issued
Sept 6, 2003
Jan 4, 2005 - two warnings issued
Jan 29, 2005
Jan 21, 2010 - three warnings issued
Sept 10, 2011
July 1, 2016
Sept 23, 2019
Nov 29, 2019 - two warnings issued

List for Pinal County:
Nov 18, 1986
Jan 18, 1993
Mar 7, 1994
Sept 4, 1994
Aug 14, 1997
Sep 12, 1997
July 6, 1999
Jan 21, 2010
Sep 10, 2011 - two warnings issued
Jul 14, 2017 - two warnings issued
Nov 29, 2019 - two warnings issued

Phoenix Dry Streak Is Over!

- Posted in Weather Facts by

It's official, at approximately 1:55 pm (on November 19th), Phoenix Sky Harbor measured 0.01" of rain! This tip of the rain gauge broke the 53-day long dry streak in Phoenix, as the last measurable rain at the airport was back on September 26th.

This dry streak is nowhere near the record set in 1972, which stands at 160 days. No rain was measured from December 30th, 1971 to June 6th, 1972.

With that said, we are still well below average when it comes to rainfall this year. As of this morning (before the rain), Sky Harbor was sitting at 3.68" of rain for the year, which is 3.18" below the average year-to-date total of 6.86". The good news, the storm system moving through the state right now should help put a dent in this deficit.

Phoenix: Record High Temperatures Sunday?

- Posted in Weather Forecast by

Temperatures on Sunday afternoon in Phoenix are not going to feel like it's the middle of November, but like the middle of October. The forecast high this afternoon in Phoenix is 87º. Not only is this forecast high 12º above average, it would also tie the record high for the day set in 2008.

The main reason for these warm temperatures the past few weeks is high pressure. Currently, high pressure is building into the Southwest US as the low-pressure system that brought some high clouds to the region the past few days drifts southward off the coast of Baja.

The good news, these temperatures won't last long. The low off the coast of Baja will slowly move northeast into Arizona late Monday into Tuesday as another storm system drops down into the region from the Pacific Northwest. These two storms will bring rain chances to the Valley of the Sun Tuesday afternoon through Thursday, along with much cooler temperatures. In fact, by Wednesday through next weekend, temperatures are forecast to be in the 60s!

Stay tuned for more information about the rain chances mentioned above. For now, if you like the warm weather, enjoy today and tomorrow!

Arizona Drought Update: November 2019

- Posted in Drought by

It was a dry monsoon, and so far, a dry fall. Phoenix, as of November 15th, is sitting at 3.68" of rain for the year, which is 3.11" below average. Most locations across the high country of Arizona are also running below average for the year. This means one thing: expanding drought.

Severe drought now covers 45.56% of the state, which is a 6% increase from just last week.

Even though drought is increasing, it is still better compared to what we were seeing last year at this same time. In November 2018, 4.33% of the state was in Exceptional Drought with 8.27% in Extreme Drought.

It is looking like a pattern shift will be taking shape next week, which could bring beneficial rain to the state. One storm will certainly not end the drought; however, anything will help!

October 2019: No rain in Phoenix

- Posted in Weather Facts by

What a difference a year can make! If you remember back to just last year, Phoenix Sky Harbor measured 5.35" of rain in October. This total smashed the October rainfall record, with the old record being 4.40" in 1972. On the other hand, this year, Phoenix measured nothing.

So how rare is this? The short answer: it's not. Out of 124 years, Phoenix has recorded no measurable rain in October 26 times (21% of years). The average rainfall total for October is 0.59", which is the 4th driest month.

As of October 31, 2019, Phoenix has officially recorded 3.68" of rain for the year, which is 2.82" below average for this time of year. As can be seen, we certainly need rain; however, the latest trends are looking dry for at least the first half of November.

Phoenix: Number of 110º Days Per Year Increasing

- Posted in Weather Facts by

Phoenix Sky Harbor has recorded 29 days so far this year with a high of 110º or higher; this is now the 4th most Phoenix has recorded since records began in 1896.

So how has the number of 110º or higher days changed throughout this period of record?

For starters, in 1911 there were no 110º+ days, and in 2011 there were 33 days, which currently stands as the record. The current climatological 30-year average (1981-2010) is 18 days per year, but let's take a closer look at the average over time.

Examining the rolling 30-year average from 1896 to 2018, it's easy to see that it is going up. In 1925, the average was just five days per year, and now including this year, the average is 20 days. Even though we see an increasing number of 110º days, there is a piece of good news, and that is that the rate of increase has slowed (more text below graph).

Monsoon 2019: Season-ending Rainfall Scenarios for Phoenix

- Posted in Monsoon by

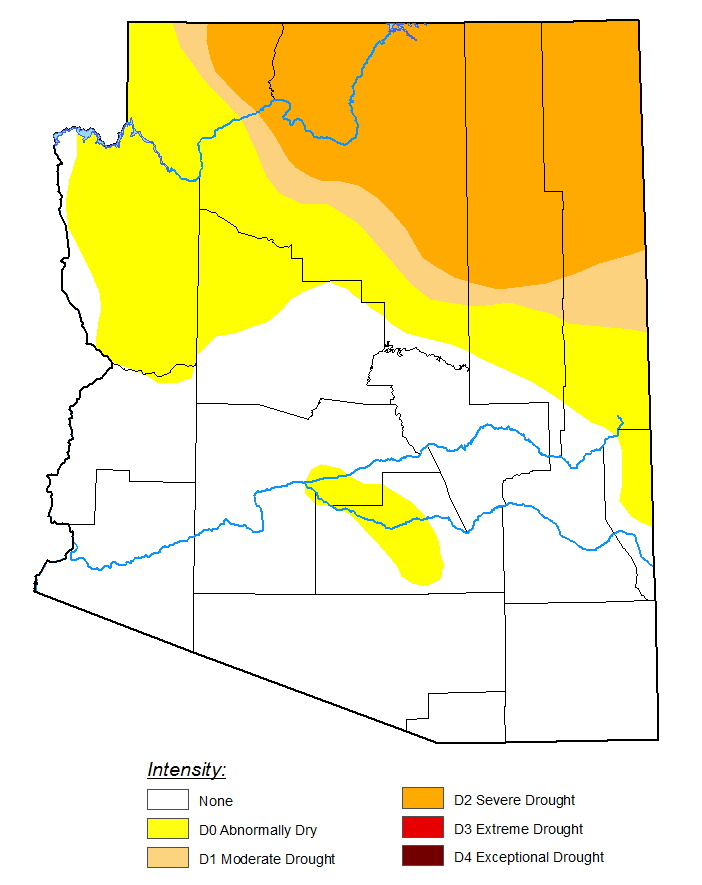
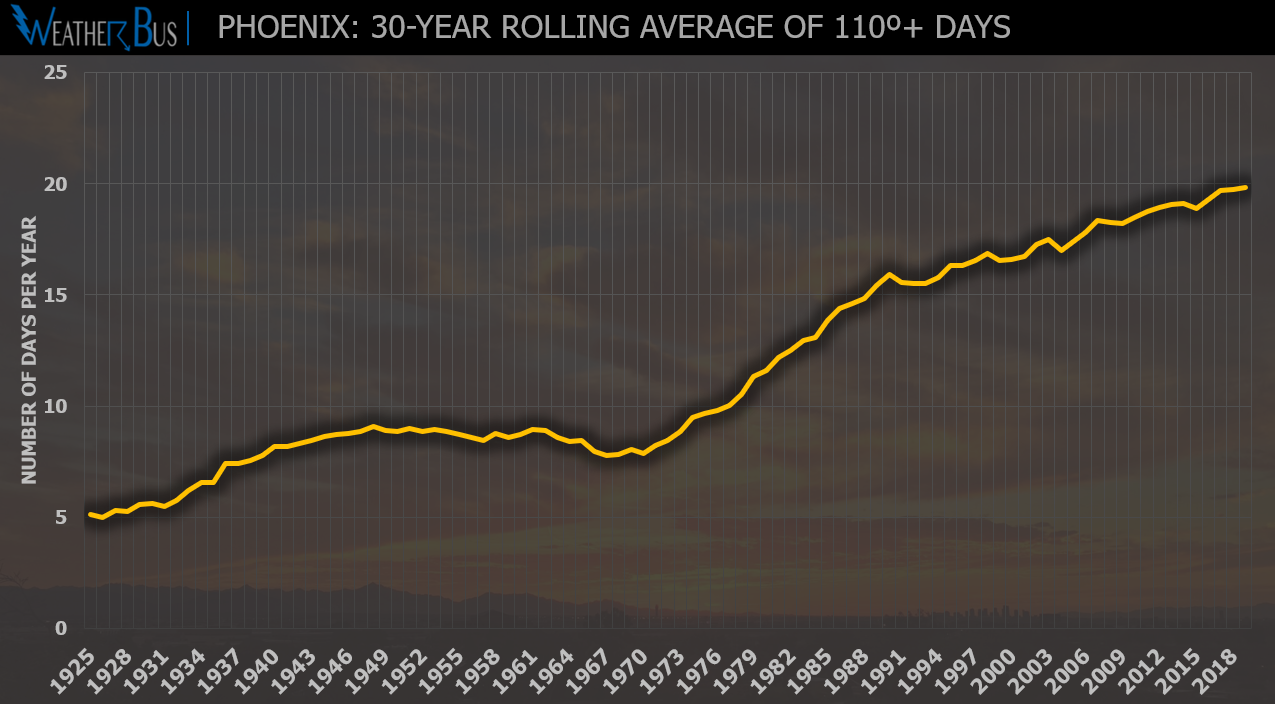
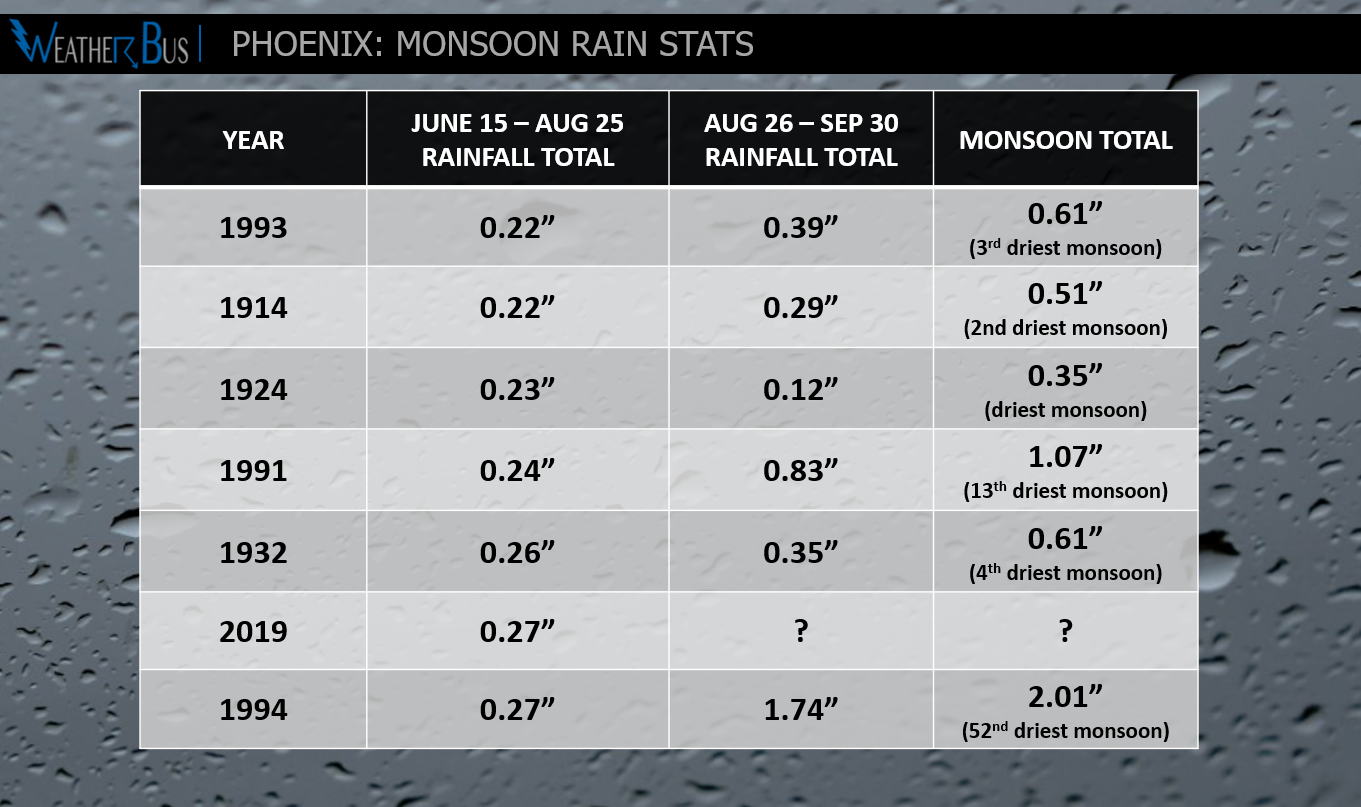
Phoenix is in the midst of the fifth driest monsoon on record when looking at rain totals at Sky Harbor from June 15th through Aug 25th. The big question: do we have a chance of ending Monsoon 2019 on a wet note?

The average monsoon total for Phoenix is 2.71", meaning, to get to average, Sky Harbor would need to measure 2.44" of rain before the season ends on Sept 30th. Over the past 123 monsoons, there have only been 11 where 2.44" or more of rain has fallen between Aug 26th-Sept 30th (9% of monsoons).

Just looking at that fact, it's not hard to see that it will take quite a bit to get Monsoon 2019 to normal. But let's break down the numbers and run some different rain scenarios to see just how much (or little) rain we could see by the end of the season!

Average Scenario: 
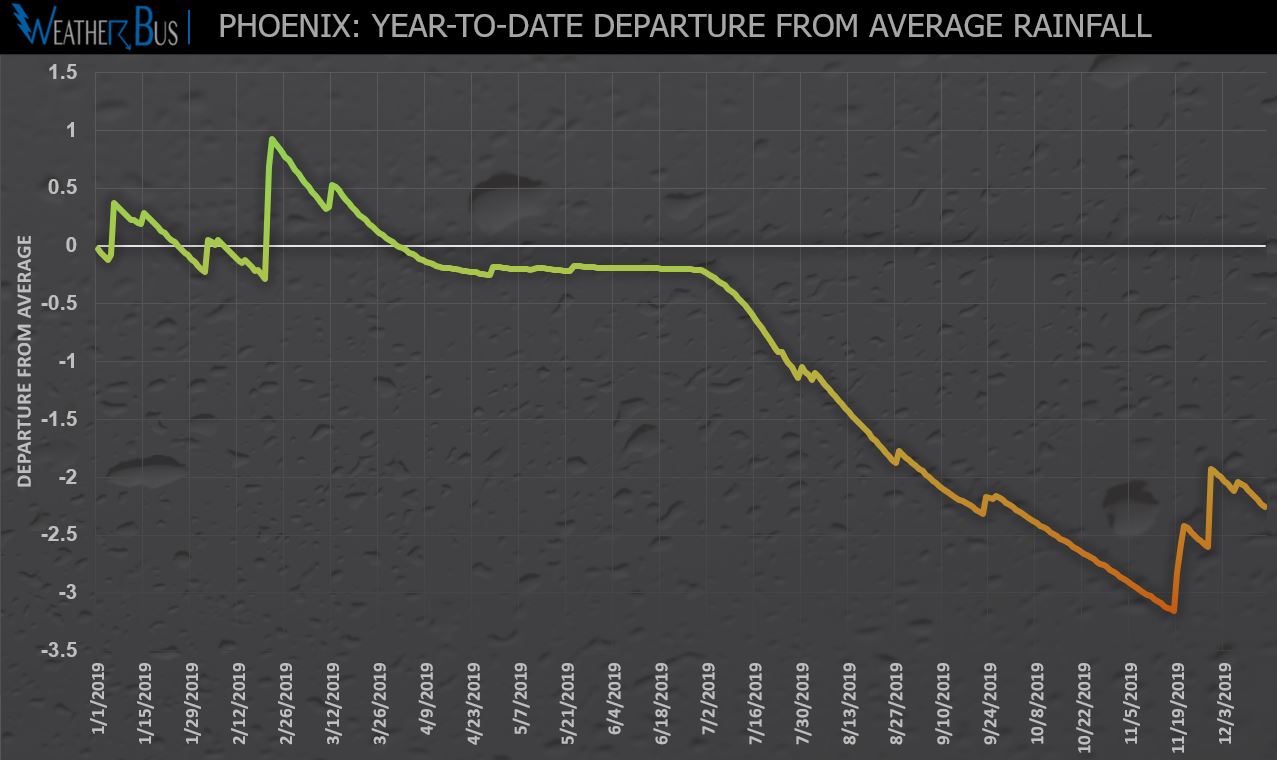
First, since there are only 36 days left in Monsoon 2019, time is starting to run out. On average, Phoenix Sky Harbor picks up 0.81" of rain between Aug 26th - Sept 30th. Using just this average, it would put the Monsoon 2019 total at 1.08", which would be 1.63" below average. This total would also place Monsoon 2019 as the 14th driest monsoon on record.

Worst Scenario: There have been nine years in the past 123 monsoons where no rain has fallen from August 26th-Sept 30th. This would mean the Monsoon 2019 total would come in at 0.27", breaking the record for the driest monsoon. The record currently stands at 0.35" set in 1924.

Best Scenario: For those glass half full people, let's switch over to the best-case scenarios. We will start with the "absolute" best case, which is very unlikely to occur. The most amount of rain to fall from Aug 26th-Sept 30th was 5.41" in 1939, followed by 5.11" in 2014 (remember Hurricane Norbert?) If Monsoon 2019 followed in the footsteps of 1939, it would end up with 5.68" and come in as the 12th wettest monsoon on record. Again, the odds are slim, but what I'm saying is, "there is a chance!"

Now for the "middle" best case. Using the top 30 highest end of monsoon rainfall totals from Aug 26th-Sept 30th, the average rainfall comes in at 2.45". Using this average, Monsoon 2019 would come in at 2.72", which would be just 0.01" above average.

Finally, for the situation that is more likely to occur and is considered the "least" best case, we will take the driest 30 monsoons based on rainfall from June 15th-Aug 25th and examine how those monsoons ended. Using these years, the average rainfall to end the monsoon is 0.74", which would bring the Monsoon 2019 total to 1.01" (1.70" below average). Using the same thirty years, the most rainfall to fall between Aug 26th-Sept 30th was 2.15", with the least being 0.07". Using these two values would make the Monsoon 2019 total 2.42" or 0.34" respectively. Both totals are still below average, with the 0.34" coming in as the direst monsoon on record. Again, the current record stands at 0.35" set in 1924.

Overall, it's looking very likely that Monsoon 2019 will end well below average. The table below shows the top five driest monsoons on record based on rainfall from June 15th-Aug 25th (with 1914 and 1993 tying as the driest, and 1994 and 2019 tying as the 5th driest). The sad part of this, looking at the overall monsoon total the top four driest monsoons are on this list.

Pyrocumulus Forms Over Woodbury Fire

- Posted in Wildfires by

The human-caused Woodbury fire has been burning east of the Phoenix valley since June 8th. During the heat of the day, when relative humidity is the lowest, the fire becomes very active with a noticeable smoke column seen from across the Valley. At times, it may have looked like a thunderstorm was forming at the top of the smoke column. Your eyes are not tricking you; this is called a pyrocumulus.

Let's start with the word itself. "Pyro" is Greek for fire and "cumulus" is Latin for heap (think puffy heap "cumulus clouds"). Put them together, and you get "fire cloud" or pyrocumulus. These types of clouds are also a clear sign that the fire is creating its own weather. So, how do they form?

There are several things to remember when looking at the formation of pyrocumulus. First, a large percentage of what makes up smoke is water vapor. Second, for condensation to form, it needs a condensation nuclei for liquid water to form on. Third, smoke is also made up of tiny particles that are 2.5 microns or less in size. To put this size into scale, a human hair is about 50 microns in diameter, so smoke particles (PM-2.5) are about 20 times smaller than a human hair and make perfect condensation nuclei. And finally, fire is extremely hot. According to the Natural Resources Canada, the average wildfire burns at around 1,400ºF, with an intense fire exceeding 2,000ºF.

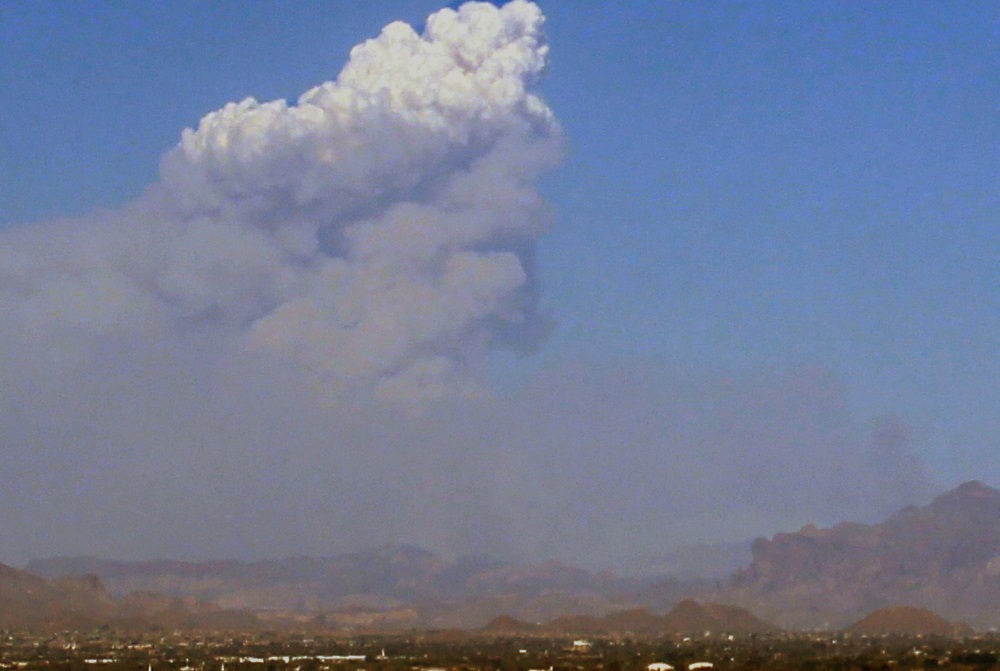
A pyrocumulus begins to form when a fire becomes active and produces extremely hot air and smoke. The hot air and smoke begin to quickly rise into the atmosphere, which is also called an updraft. This updraft is the same as you would see with any thunderstorm; however, it is much stronger given the heat from the fire. As the updraft rapidly forces air up, condensation occurs due to all the water vapor in the smoke and the millions of condensation nuclei present. Once all of this comes together, you will visually see the pyrocumulus cloud rise above the fire, reaching heights at times of over 30,000 feet.
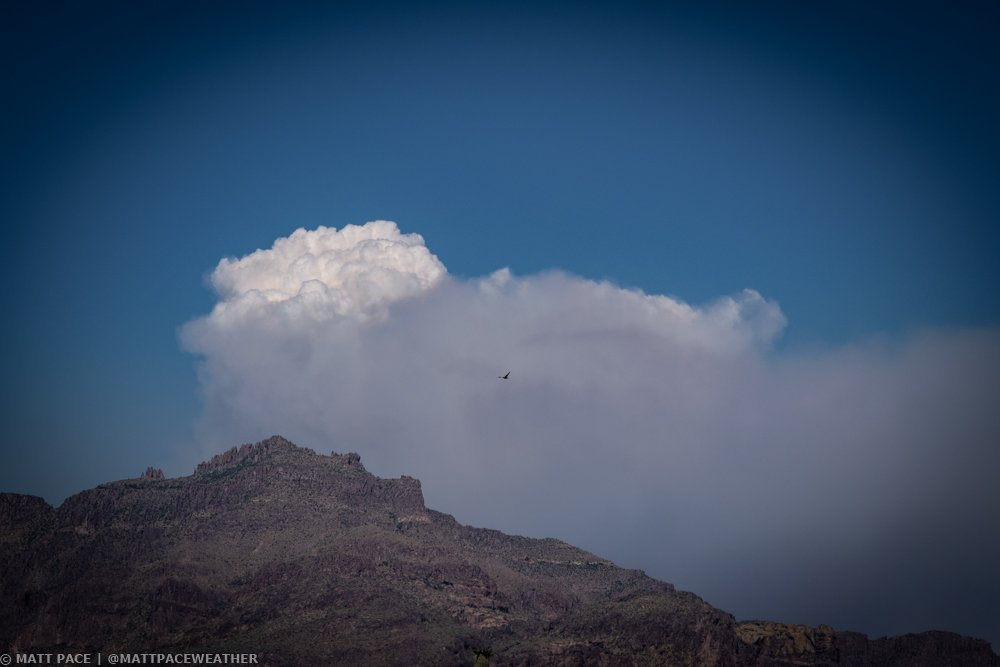
These pyrocumulus clouds can also indicate extremely dangerous weather conditions on the ground. As air rapidly rises above the fire into the updraft, the air at the surface has to be replaced. Since air is not coming out of the ground, it has to come in from the side, producing strong and often erratic winds, that only act to increase the intensity of the fire.

Pyrocumulus can get big enough to become full-fledged thunderstorms with all the same threats: lightning, downbursts and rain. The two biggest threats are (1) lightning, which can create new fires and (2) downburst winds that can cause 50+mph winds over the fire.