Phoenix is in the midst of the fifth driest monsoon on record when looking at rain totals at Sky Harbor from June 15th through Aug 25th. The big question: do we have a chance of ending Monsoon 2019 on a wet note?
The average monsoon total for Phoenix is 2.71", meaning, to get to average, Sky Harbor would need to measure 2.44" of rain before the season ends on Sept 30th. Over the past 123 monsoons, there have only been 11 where 2.44" or more of rain has fallen between Aug 26th-Sept 30th (9% of monsoons).
Just looking at that fact, it's not hard to see that it will take quite a bit to get Monsoon 2019 to normal. But let's break down the numbers and run some different rain scenarios to see just how much (or little) rain we could see by the end of the season!
Average Scenario:
First, since there are only 36 days left in Monsoon 2019, time is starting to run out. On average, Phoenix Sky Harbor picks up 0.81" of rain between Aug 26th - Sept 30th. Using just this average, it would put the Monsoon 2019 total at 1.08", which would be 1.63" below average. This total would also place Monsoon 2019 as the 14th driest monsoon on record.
Worst Scenario:
There have been nine years in the past 123 monsoons where no rain has fallen from August 26th-Sept 30th. This would mean the Monsoon 2019 total would come in at 0.27", breaking the record for the driest monsoon. The record currently stands at 0.35" set in 1924.
Best Scenario:
For those glass half full people, let's switch over to the best-case scenarios. We will start with the "absolute" best case, which is very unlikely to occur. The most amount of rain to fall from Aug 26th-Sept 30th was 5.41" in 1939, followed by 5.11" in 2014 (remember Hurricane Norbert?) If Monsoon 2019 followed in the footsteps of 1939, it would end up with 5.68" and come in as the 12th wettest monsoon on record. Again, the odds are slim, but what I'm saying is, "there is a chance!"
Now for the "middle" best case. Using the top 30 highest end of monsoon rainfall totals from Aug 26th-Sept 30th, the average rainfall comes in at 2.45". Using this average, Monsoon 2019 would come in at 2.72", which would be just 0.01" above average.
Finally, for the situation that is more likely to occur and is considered the "least" best case, we will take the driest 30 monsoons based on rainfall from June 15th-Aug 25th and examine how those monsoons ended. Using these years, the average rainfall to end the monsoon is 0.74", which would bring the Monsoon 2019 total to 1.01" (1.70" below average). Using the same thirty years, the most rainfall to fall between Aug 26th-Sept 30th was 2.15", with the least being 0.07". Using these two values would make the Monsoon 2019 total 2.42" or 0.34" respectively. Both totals are still below average, with the 0.34" coming in as the direst monsoon on record. Again, the current record stands at 0.35" set in 1924.
Overall, it's looking very likely that Monsoon 2019 will end well below average. The table below shows the top five driest monsoons on record based on rainfall from June 15th-Aug 25th (with 1914 and 1993 tying as the driest, and 1994 and 2019 tying as the 5th driest). The sad part of this, looking at the overall monsoon total the top four driest monsoons are on this list.

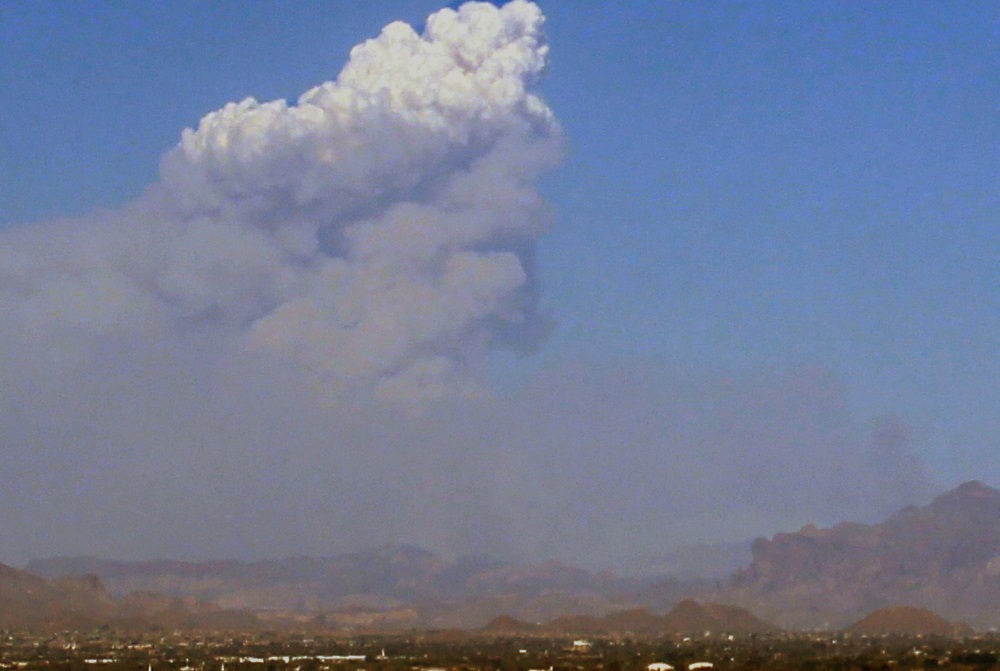
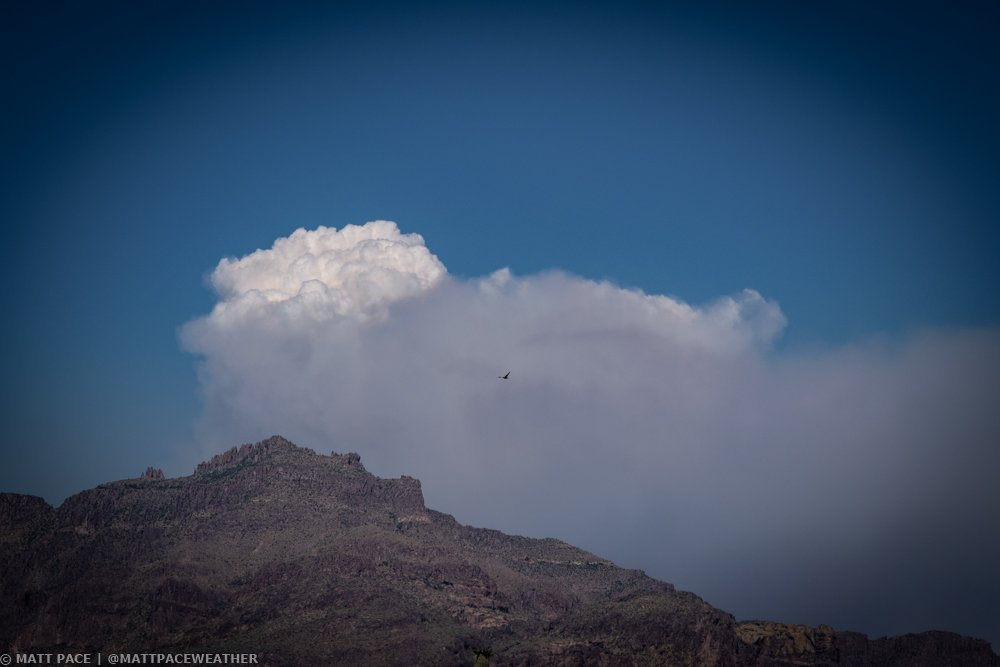
 A pyrocumulus begins to form when a fire becomes active and produces extremely hot air and smoke. The hot air and smoke begin to quickly rise into the atmosphere, which is also called an updraft. This updraft is the same as you would see with any thunderstorm; however, it is much stronger given the heat from the fire. As the updraft rapidly forces air up, condensation occurs due to all the water vapor in the smoke and the millions of condensation nuclei present. Once all of this comes together, you will visually see the pyrocumulus cloud rise above the fire, reaching heights at times of over 30,000 feet.